
Is a spreadsheet the right tool for the job?
The other day I saw a video of a Japanese man who makes beautiful art using the drawing tools available in Excel. Painstakingly printing and piecing together a4-sized panels to make large canvases for display. They called him "The Michelangelo of Excel".
It's quite amazing. You can really do almost anything within Excel.
But should you? When is a spreadsheet the appropriate tool to use, and when should we be looking for something else?
Spreadsheets are familiar, flexible and easy to use. The instant visual feedback you get when playing with data makes them the go-to choice for many who want to do quick number manipulations, and iterate on charts and reports.
It’s very tempting to use a spreadsheet for any task that has a dataset that can be represented with tables. Excel’s feature list has grown to encompass just about anything a general purpose programming language could do. Anything else can be easily filled in with add-ins and macros.
This means Excel is regularly used and abused in ways that are inappropriate for an application where you need a high assurance of quality and reliability.
But if Excel is* capable *of doing it, why wouldn’t you?
All the features of Excel that makes for a great, instant feed-back-loop that lets you try different things to manipulate and visualize your data, make the long term stability of the code base very difficult. This is especially true if you’re trying to re-use the formulas and other mechanisms to analyse different or evolving data sets.
When you start getting outside of manipulating and charting tables of data, you're dependent on features that are built around very specific assumptions about the shape of your data. The configuration of these features resides in new layers - for example within validation forms, data connection screens, or pages of vba. The more of these layers you add, the more inscrutable the operations on your data become.
You start seeing edge cases and unexpected behaviour cropping up that take time to debug and build around. All of this adds to the development time, and increases the chances of problems cropping up in daily use. There are ways to reign this in, best practices for developing high quality Excel spreadsheets that are easy to test and validate.
It's going to take time and resources. So before you start, you need to ask whether you should be using Excel at all! Perhaps there's a an off-the-shelf, purpose built solution to your problem? Or maybe it's just going to be better to us a traditional programming language and build upon a real relational database.
Here are a few scenarios that might prompt you to question using Excel:
•
Are there multiple users and roles trying to share a changing, central source of data?
•
Is there complex user interaction beyond what is provided by the basic worksheets interface? i.e. are you going to build a bunch of forms for data entry and configuration?
•
Does the tool have to communicate with external systems to control workflows or critical operations?
•
Are you using Excel to
directly enter original observations
of regulated raw data?
Now, these aren't hard and fast rules, and Excel definitely allows you to handle most of these things with the help of a little VBA or a few add-ins. But if you answered yes to any of these then it's a sign that you could save yourself a lot of headaches by looking for a more appropriate alternative to Excel.
Until next time, thanks for reading!
– Brendan
Why consider buying software when a spreadsheet can be built so quickly?
Why consider buying software when a spreadsheet can be built so quickly?
A spreadsheet seems cheap and quick - you can put together a proof-of-concept in a day, so why would you spend thousands on software?
You’ve all heard of the 90/10 rule – basically it says that that 10% of the work takes 90% of the time to complete.
Outside of the proof-of-concept phase, building something complex, high quality and robust to real data sets takes time, effort, and expertise. Using Excel in particular, all those features that makes it easy to build and make quick changes with an instant feed-back-loop? They start to work against you.
Having the data and the code intermixed in the same interface? Great for making a quick table and chart. Terrible for tracing complex interactions and behaviour.
Formulas and automated formatting code that changes invisibly when you drag & drop, insert, or delete cells? Fantastic for prototyping! A huge time sap when you’re making changes to large, interconnected tables.
Wizards that let you quickly set up queries, pivot tables and data sources? Amazing for quickly pulling, manipulating, and visualizing data without worrying about the complex interactions underneath. Awful for hiding limitations and assumptions about the shape of your data and results, causing headaches when your application inevitably comes up against those limitations.
What started off as a quick prototype that you strung together using a small example data set, some wizards and various formulas and macros copied from the internet, ends up in an endless build cycle. As time goes on you unearth more and more edge cases that break the system, or worse, silently provide subtly wrong answers. You’re doing small fixes every time you try to use the tool.
Properly testing parts of it becomes nearly impossible. Trying to trace what went wrong when a bug does surface? Well, only Bob understands what it’s doing anymore and he’s off in Tahiti for the week.
All this to say: Building a complex, high quality, validatable spreadsheet is a
software development project
. It takes expertise, time, and resources to develop, test thoroughly, and validate. Sometimes that’s exactly what’s needed.
But: if you can just buy something to solve the problem, and solve it better, shouldn’t you investigate that first?
Here are some examples of solved problems that I know have better solutions out there than a custom-built spreadsheet:
1.
Deviation, CAPA and issue tracking.
2.
Inventory management.
3.
Anything beyond “basic statistics”.
4.
Study project management and scheduling.
5.
Pharmacokinetic modelling and simulation.
So next time you reach for a spreadsheet to solve a critical problem in your regulated facility, spend some time looking at what’s on the market.
Yes, you might still need to do some due diligence – requirements setting, vendor qualification, system validation, etc. But doing this for off-the-shelf software might be much less work than writing something complex and bespoke in-house, especially if the vendor supports regulated use through compliance packages and on-going support.
Spending some money on an existing software solution might turn out to be a bargain in comparison.
Until next time, thanks for reading.
– Brendan
When should you use a database instead of a spreadsheet?
When should you use a database instead of a spreadsheet?
Ok. So, you're building something based around persistent 'tables' of data. You’ve checked out the software options out there, and nothing fits right. You’ve got good reasons for building something in-house. Now, Excel has many features that make it seem like a ‘database-light’ - multiple indexed tables, advanced queries, data connections, etc. That would be a natural choice, wouldn't it?
When would you reach for a database instead?
While on the surface they look like they do similar things with data, a traditional relational database can provide several features that would require a lot of effort in Excel:
•
A single, central source of truth that can be accessed by many users/clients.
•
Built-in support for users, roles, and authentication.
•
Guarantees on the data type of any record.
•
Guarantees on data validity despite errors, power failures or other interruptions (called the ACID guarantees: Atomicity, Consistency, Isolation, Durability).
•
Built to model complex relationships on large sets of data and quickly examining them through queries.
•
Optimized for large datasets and high throughput rather than for display and manipulation.
•
A wide choice of ways to access the data, for example prebuilt frontends, programming language, query languages and tools.
When we’re building something for use in a regulated environment, there are two further differences to consider:
1.
Separation of data from code.
In Excel you get a mishmash of data, formatting, calculations, and other operations all in the same UI. In a database is a fundamental separation between the raw data and the operations on that data - any such operations are always done
after
the data has been retrieved from the record.
2.
Ease of structural modifications.
Excel is optimized for easily changing the
shape
of your raw data and the operations on it. On the other hand, once the structure, relationships and any built-in operations on the expected data are set for a database, it’s relatively difficult for a user of the system (as opposed to the developer of the system) to change those. A database is optimized for reading and writing the data within that structure.
These mean better guarantees that your
well-tested and validated
database isn’t going to change its behaviour next Tuesday.
Of course, there is a cost to these guarantees – By itself, you’re not going to have a particularly user-friendly way of visual development or data interaction like you do in Excel. While some database products, like Microsoft Access, do try to provide visual front ends for simple data modelling or query building, in general they’re just not going to be as easy to develop in, as feature-complete, nor as familiar as an Excel spreadsheet.
And so, a database requires a higher level of expertise to build than our familiar Excel spreadsheet. It will probably require some programming too. It’s a trade-off.
But when you have a large, central source of data that you want several users to access concurrently with different roles and permissions, you probably want to go with a database instead of Excel.
Until next time, thanks for reading!
– Brendan
Data Analysis using Spreadsheets vs. Two Alternative Software Models
Data Analysis using Spreadsheets vs. Two Alternative Software Models
Today let's look at some simple models for processing and analysing sets of data: first, using a spreadsheet, then using a "traditional" software program or script. Finally, we'll look at how that flow changes for a database-centered application.
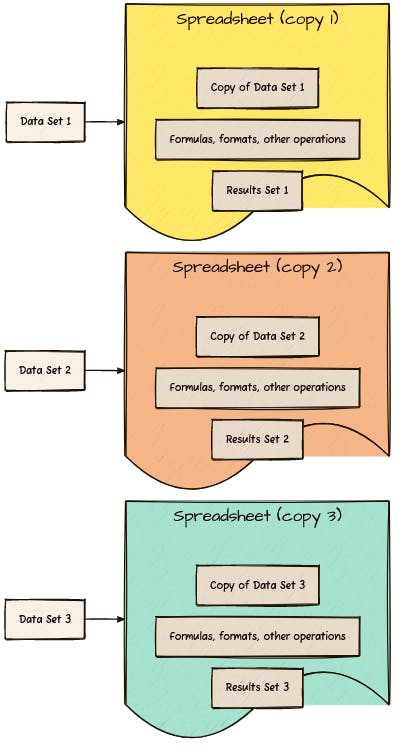
In a spreadsheet, the data, code (functions, formatting, reporting, etc.) and results are intermingled. Data is transcribed or copied into the spreadsheet, and results are stored within the spreadsheet as well. The copied data and its results are kept together along with the mechanism used to process and report it. This also means you need to make and modify a new copy of the spreadsheet for each set of data you want to analyse.
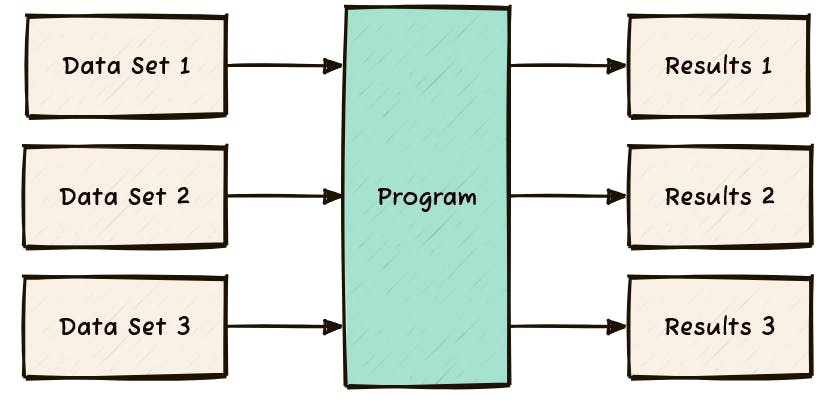
In the traditional software model for data processing, you write the program once. Data goes in and results come out. The same copy of a program can process many different datasets. The data may be in any format supported by the program, so the program can be written so that original data sets may be used without translation. Similarly, results may be output into any supported format. You lose the inherent link between data and results but gain independence - neither the data nor the results change the underlying program.
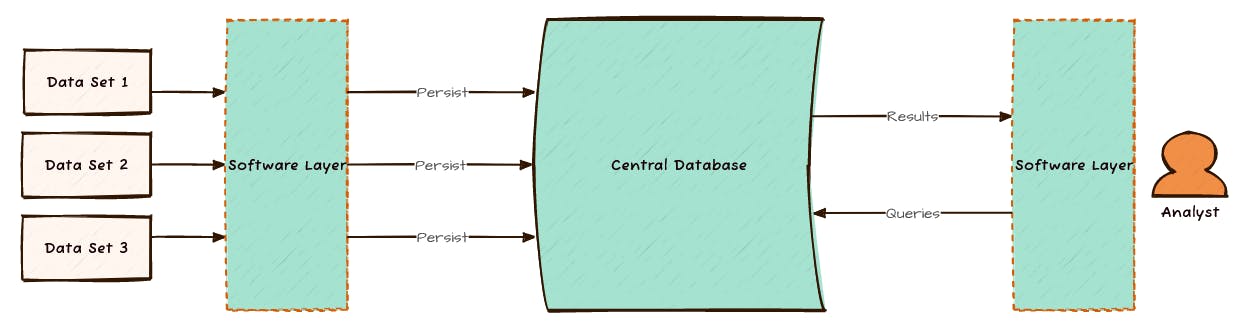
With a database-centered model, you introduce a persistent data storage element. Data goes into the database, usually through some software layer, and stays there. It might be manually entered through a form, pushed in from some source in batches, or it might be a continuous stream. Either way, the data goes in, and it stays there.
On the other end of things, queries are made against the database (rather than the original set of data), again usually through a software layer. Any calculations or formatting are separate from the data layer. Results are interpreted and presented independent of the data input step.
Yes, but I can make Excel do...
Yes, but I can make Excel do...
Of course, you can also bend spreadsheets to use features closer to its alternatives – for example you could do some fancy multi-spreadsheet source linking and querying to copy the database model, using spreadsheets both for persistent storage of tables and for doing queries against the current state of those tables. I know there are many businesses who have been doing exactly that with years worth of their financials!
You could also write a traditional program that allows you to keep data, operations, and results side-by-side in the same file or database, modifying the operations as you go like you would with a spreadsheet. Many "Data Notebook" style programs do exactly this, though their usefulness in a regulated environment is limited.
In the end all three models are valid for various use cases, but there's usually a trade-off, especially if you're pushing the boundaries of one or the other. The more you push those boundaries, the more you're spending time and resources to create a (poorer) knockoff of an existing technology.
Hammering in your nails with the blunt end of a screwdriver.
Until next time, thanks for reading!
– Brendan
When is it worth building a spreadsheet template?
When is it worth building a spreadsheet template?
Let's say you had some data that had to be calculated and reported the same way every month for the foreseeable future. Would you build a new spreadsheet from scratch every month? Of course not, that would be a waste of effort, right?
So we put in effort up-front and build a spreadsheet template containing the formulas and charts we can apply to the data every time. If it takes us two hours to build that spreadsheet, then not having to re-build it from scratch every month would save two hours a month. A clear win, right?
Now consider the situation where your data "changes shape" every month - perhaps the number of data points fluctuates, or there's optional fields that are reported only in the summer. And sometimes the manager wants the chart to be blue and green, and in other months, pink and mauve.
It takes longer to build a template that's flexible enough to handle those monthly changes than it would to build it for one data set. Let's say the flexible template would take four hours up front, verses the two hours every month to build the spreadsheet specifically for that month's data.
Is it still worth it? What if it would take forty hours to build the template? How about 1000 hours?
There's probably some sort of net present value equation here that would help us figure it out.
(PRO tip: if you're in the thousands of hours range, you might start wondering if a spreadsheet is the wrong tool for the job...)
Are the "number of development hours" the only measurement that matters here?
Consider this: If we repeat the 'spreadsheet building' activity every month, then we also have a chance of making a critical mistake in the code. Every. Single. Month.
If that mistake is part of some legal monthly reporting requirement that could trigger a weeks-long audit from the authorities, perhaps spending 1000 hours to avoid that audit that would be a bargain?
Here's the thing: When you have a repetitive process any errors, inefficiencies, or points of risk are multiplied across its lifetime. To avoid this we must
move complexity out of the repeating part of the process
.
Until next time, thanks for reading!
– Brendan
Subscribe to the HaiQu newsletter!
Join me on the HaiQu newsletter as we take a few minutes to explore, design, test and improve the critical systems we use in our regulated facilities. From spreadsheets and software to SOPs and forms and beyond.
We'll never share your email. Unsubscribe any time.